Concepts addressed: box-and-whiskers plot, mean, variance, standard deviation.
Recommended grade: 11th.
Difficulty level: Basic.
Scenario:
Sure, school is kind of fun and all, but you’ve always thought that maybe becoming a streamer is the way to go. After all, have you seen how much money some of them make?! Well, we’ll never know if it’s worth it until we give it a try.

- You decide to post a few videos where you play an online game and see what the reception is. In a week, you create a 13 min, 23 min, 15 min, 8 min, 13 min, and 28 min video. Assuming that every minute of video takes roughly 5 mins to edit, draw a box-and-whiskers plot of the time you spent preparing the videos (remember that “preparing” means both recording and editing).

- There haven’t been too many viewers yet, mostly your friends and family. Still, they seem to have enjoyed it, especially your 6-year-old brother. Encouraged by this, you begin counting the money that will surely be in your pocket at the end of the month. If we assume that every minute of a video earns you $0.20, how much money on average did you make per video? Count the variance and the standard deviation of your income.

- You already feel your future superstardom. Let’s try to post three new videos, but this time let’s make them shorter: 5, 7, and 6 mins. How does that change the average, the variance, and the standard deviation?

- This streaming business is new to you, so why not learn from the best? Your favourite game streamer must know something about it since they have a few million subscribers. You check their last 7 videos to figure out the strategy that somehow worked for them. Their lengths are: 21 min, 26 min, 20 min, 22 min, 35 min, 22 min, 24 min. Draw a box-and-whiskers diagram for this data (remember to add the time to edit the videos) and compare it with the one you’ve obtained in question 1. What are the differences and similarities? Can you guess (without drawing) how your plot would change if you’d added the three extra videos mentioned in question 3?
Why do we calculate variance and standard deviation?
The average of our data suggests, more or less, what the numbers are. However, it paints a very rough picture since individual values may be a lot smaller or a lot larger than the average. The variance and the standard deviation give us more information on how far from the average we are with our data. To be precise, a very small variance tells us that our numbers are very close to each other. A large variance says that there are values which greatly differ from the average.
Useful calculators:
- Mean median mode calculator – https://www.omnicalculator.com/statistics/mean-median-mode
- Average calculator – https://www.omnicalculator.com/math/average
- Standard deviation calculator – https://www.omnicalculator.com/statistics/standard-deviation
- Exponent calculator – https://www.omnicalculator.com/math/exponent
- Square root calculator – https://www.omnicalculator.com/math/square-root
Question 1 hints:
Question 2 hints:
Question 3 hints:
Question 4 hints:
Solutions:

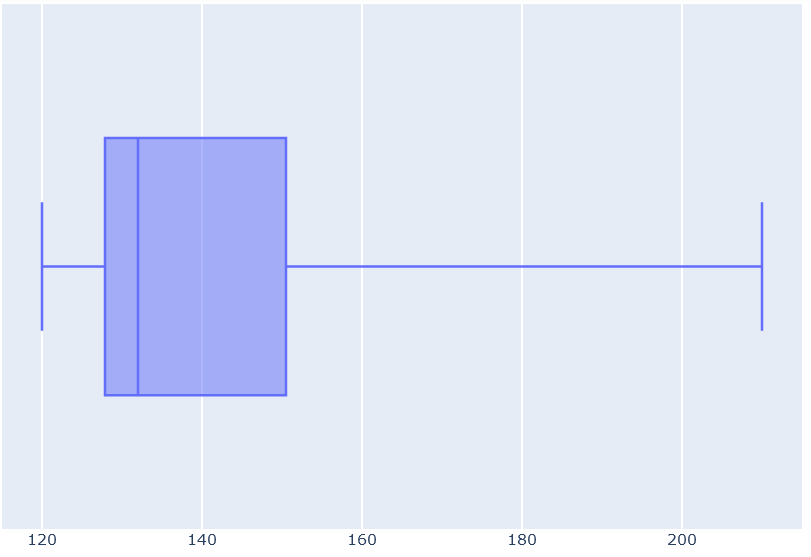
The box this time is much “thinner,” which means that the video lengths are on average of similar lengths. However, the right whisker is quite far from the box. This corresponds to the one very long video, but looking at the whole plot we can deduce that it was more of an exception than a regular thing.
All in all, we can suspect that the famous youtuber’s strategy is to post videos of more or less the same length. To be precise, a bit over 20-minute-long. Also, observe that this differs a lot from the three additional videos that we’ve added in question 3. Therefore, we can deduce that if we want to follow our favourite youtuber’s pattern, we shouldn’t post such short ones in the future.
Step-by-step solution:
| 1st | 2nd | 3rd | 4th | 5th | 6th | |
| video length | 8 mins | 13 mins | 13 mins | 15 mins | 23 mins | 28 mins |
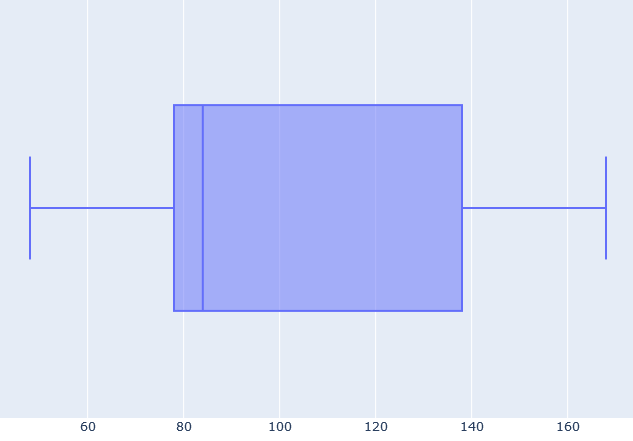
However, we are interested not in the video lengths, but in the time it took to prepare them. The scenario says that every minute of a video requires 5 mins of editing. Therefore, every 1 min of footage will need 1 min + 5 min = 6 min in total to prepare. This means that we need to multiply the above sequence by 6:
| | 1st | 2nd | 3rd | 4th | 5th | 6th |
| video length | 8 min | 13 min | 13 min | 15 min | 23 min | 28 min |
| preparation time | 48 min | 78 min | 78 min | 90 min | 138 min | 168 min |
To draw the box-and-whiskers plot, we will need to find the 1st, 2nd, and 3rd quartile. The 2nd one is the median of our numbers, so we can use the mean median mode calculator:
(78 min + 90 min) / 2 = 84 min.
Similarly, the 1st and the 3rd quartile are the medians of the first and the second half of the sequence, respectively. Again, the calculator gives these as 78 and 138 mins, respectively.
The three quartiles that we counted above describe the box of our plot. On the other hand, the whiskers are given by the minimum and maximum values, which are 48 min and 168 min, respectively. All in all, we get the plot drawn below.
| | 1st | 2nd | 3rd | 4th | 5th | 6th |
| video length | 8 min | 13 min | 13 min | 15 min | 23 min | 28 min |
| money worth | $2.60 | $4.60 | $3.00 | $1.60 | $2.60 | $5.60 |
Well, maybe those are not big numbers, but it’s just the beginning of our career. Surely they will grow in time, right?
NOTE: Observe that this time we did not order the numbers as in Question 1. When counting the average, the variance or the standard deviation, the order of the values doesn’t matter.
Anyway, let’s see how much we’ve made per video on average. For this we will need to add all the above values and divide them by how many there are. The average calculator gives us
average₁ = ($2.60 + $4.60 + $3.00 + $1.60 + $2.60 + $5.60) / 6 ≈ $3.33.
We move on to the variance. For this, we will need to see how much each value differs from the average. This means that we need to take the money sequence and subtract from each number the average of $3.33. We obtain:
| | 1st | 2nd | 3rd | 4th | 5th | 6th |
| video length | 8 min | 13 min | 13 min | 15 min | 23 min | 28 min |
| money worth | $2.60 | $4.60 | $3.00 | $1.60 | $2.60 | $5.60 |
| difference from average | -$0.73 | $1.27 | -$0.33 | -$1.73 | -$0.73 | $2.27 |
Unfortunately, this is still not the sequence we need. We need the square of numbers we just found. We can use the exponent calculator to get approximately:
| | 1st | 2nd | 3rd | 4th | 5th | 6th |
| video length | 8 min | 13 min | 13 min | 15 min | 23 min | 28 min |
| money worth | $2.60 | $4.60 | $3.00 | $1.60 | $2.60 | $5.60 |
| difference from average | -$0.73 | $1.27 | -$0.33 | -$1.73 | -$0.73 | $2.27 |
| square of difference | 0.533 | 1.613 | 0.109 | 2.993 | 0.533 | 5.153 |
Now to obtain the variance, all we need is to add these values and divide them by how many there are minus 1, which is 6 – 5 = 1. In other words,
variance₁ = (0.533 + 1.613 + 0.109 + 2.993 + 0.533 + 5.153) / 5 ≈ 2.19.
Lastly, the standard deviation is the square root of the variance. Therefore, the square root calculator, or the standard deviation calculator, give:
standard_deviation₁ = √variance₁ ≈ 1.48.
8 min, 13 min, 13 min, 15 min, 23 min, 28 min, 5 min, 7 min, 6 min.
Again, we start by translating the length of the videos to money earned:
| | 1st | 2nd | 3rd | 4th | 5th | 6th | 7th | 8th | 9th |
| video length | 8 min | 13 min | 13 min | 15 min | 23 min | 28 min | 5 min | 7 min | 6 min |
| money worth | $2.60 | $4.60 | $3.00 | $1.60 | $2.60 | $5.60 | $1.00 | $1.40 | $1.20 |
Now we move on to the average. Observe that this time there are 9 numbers, so we need to divide the sum by 9 instead of 6. The average calculator gives
average₂ = ($2.60 + $4.60 + $3.00 + $1.60 + $2.60 + $5.60 + $1.00 + $1.40 + $1.20) / 9 ≈ $2.62.
Note how much the average fell when we added the three short videos.
Let’s find the variance. Firstly, we need to check how much our data differs from the mean. To do this, we subtract the mean, $2.62, from each value. We obtain:
| | 1st | 2nd | 3rd | 4th | 5th | 6th | 7th | 8th | 9th |
| video length | 8 min | 13 min | 13 min | 15 min | 23 min | 28 min | 5 min | 7 min | 6 min |
| money worth | $2.60 | $4.60 | $3.00 | $1.60 | $2.60 | $5.60 | $1.00 | $1.40 | $1.20 |
| difference from average | -$0.02 | $1.98 | $0.38 | -$1.02 | -$0.02 | -$2.98 | -$1.62 | -$1.22 | -$1.42 |
Now we square each number using the exponent calculator:
| | 1st | 2nd | 3rd | 4th | 5th | 6th | 7th | 8th | 9th |
| video length | 8 min | 13 min | 13 min | 15 min | 23 min | 28 min | 5 min | 7 min | 6 min |
| money worth | $2.60 | $4.60 | $3.00 | $1.60 | $2.60 | $5.60 | $1.00 | $1.40 | $1.20 |
| difference from average | -$0.02 | $1.98 | $0.38 | -$1.02 | -$0.02 | -$2.98 | -$1.62 | -$1.22 | -$1.42 |
| square of difference | 0.004 | 3.9204 | 0.1444 | 1.0404 | 0.004 | 8.8804 | 2.6244 | 1.4884 | 2.0164 |
And, to get the variance, we sum up these numbers and divide them by how many there are, minus one, which is 9 – 1 = 8. This gives:
variance₂ = (0.0004 + 3.9204 + 0.1444 + 1.0404 + 0.004 + 8.8804 + 2.6244 + 1.4884 + 2.0164) / 8 ≈ 2.51.
Lastly, we calculate the standard deviation using the square root calculator or the standard deviation calculator:
standard_deviation₂ = √variance₂ ≈ 1.58.
| 1st | 2nd | 3rd | 4th | 5th | 6th | 7th | |
| video length | 20 min | 21 min | 22 min | 22 min | 24 min | 26 min | 35 min |
Just as in question 1, we now need to find how much time it took to prepare (record and edit) the videos. This means that we need to multiply the above sequence by 6:
| | 1st | 2nd | 3rd | 4th | 5th | 6th | 7th |
| video length | 20 min | 21 min | 22 min | 22 min | 24 min | 26 min | 35 min |
| preparation time | 120 min | 126 min | 132 min | 132 min | 144 min | 156 min | 210 min |
Recall that to draw the box-and-whiskers plot, we will need to find the 1st, 2nd, and 3rd quartile. The 2nd one is the median of our numbers, so we can use the mean median mode calculator to find that it is the middle number in our sequence: 132 min.
Similarly, the 1st and the 3rd quartile are the medians of the first and the second half of the sequence, respectively. Again, the calculator gives these as
(132 min + 126 min) / 2 = 129 min
and
(144 min + 156 min) / 2 = 150 min,
respectively.
The three quartiles that we counted above describe the box of our plot. On the other hand, the whiskers are given by the minimum and maximum values, which are 120 min and 210 min, respectively. All in all, we get the plot drawn below.